You must have often come across the term called Bullwhip effect which is notorious in terms of plaguing a lot of supply chains.
Let’s start with the definition! Bullwhip effect is a phenomenon where a small demand fluctuation on the consumer side causes an increasingly large fluctuation in demand upstream towards the distributor, wholesaler, manufacturer and Raw material supplier. This resembles the cracking of a bullwhip and hence the name.

In this blog, I am going to explain the main reasons for a bullwhip. Then I am going to simulate / illustrate a bullwhip using a simple model and then we will look at some ways of managing or controlling the bullwhip effect.
Firstly, let’s look at the key factors which together give rise to a bullwhip effect
- Demand Fluctuations: Most companies use a forecast to predict the customer demand and the forecast is constantly updated based on the recent sales history. The supply plan chases this forecast and the demand fluctuations get cascaded upstream towards the manufacturer and the suppliers. If forecast accuracy is poor, the bullwhip effect is much greater.
- Order / Production Batch Size: Bullwhip effect is higher in case the batch size / lot size / order size is higher. This is simply because the incremental batch quantity is much greater than the demand increase. Let’s say the production batch quantity is 100. If demand increases to 90, there is a need to produce 1 batch. But if the demand increases to 110, there is a need to produce 2 batches. This causes the raw material demand to just double to serve the demand from customers downstream.
- Safety Stock: Safety stock is often held in days forward coverage (forecast/demand within the x number of days in the future). As the demand increases or decreases, so does the safety stock as it is directly proportional to the demand. This increased demand gets forwarded upstream which in turn swells because of another layer of safety stock carried at each level.
- Irrational / Unforeseen Demand: Sometimes, the demand does not follow the historical pattern and can suddenly drop or increase. A recent example is the panic buying of sanitisers or toilet papers during the onset of covid. With the exponential demand increase, the bullwhip was even greater. When the panic buying stopped, suddenly there was too much inventory of these items in the market. There are many examples of this phenomenon post pandemic where companies have accumulated too much stock.
- Long lead times: Longer lead times cause a bigger bullwhip effect because it takes longer for the demand to cascade and creates less reaction time for the upstream. As an example, if the lead time is 5 weeks between a wholesaler and manufacturer, then an order placed for week 6 out is manufactured in week 1. Now if the demand forecast drops the following week or the sales order doesn’t match the demand forecast, the manufacturer cannot cancel the order and which leads to inventory pile up.
I will now provide a simple illustration to explain this phenomenon. This is a simplified example which does not have any lead times or order batch sizes.
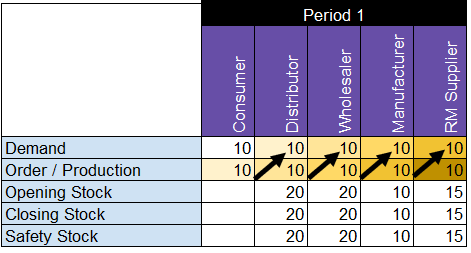
In the initial picture below, there is a demand of 10 units at the consumer which places an order of 10 to the distributor. The distributor has a safety stock policy of 2x demand and therefore the safety stock requirement is 20. Distributor has an opening stock of 20 units and therefore it places an order of 10 to the wholesaler to keep the inventory level at the safety stock. The wholesaler has a safety stock policy of 2x of demand as well. Manufacturer carries a safety stock of 1x of demand and the RM supplier carries a safety stock of 1.5x of demand. The initial picture shows a steady state where there is full equilibrium.

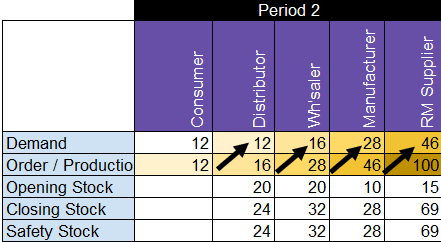
Now, in the next period, the demand increases slightly to 12 units and the customer places an order of 12 units to the distributor. The distributor now aims to carry a safety stock of 24 units (2x demand) and hence orders 16 units from wholesaler. The Wholesaler aims to carry 32 units and hence orders 28 units from the manufacturer. This pattern repeats and the result is, you guessed it right, the bullwhip effect!

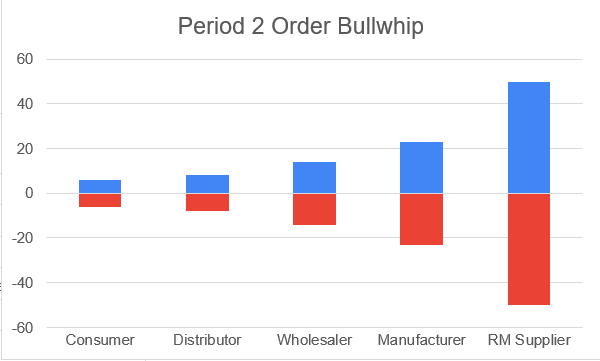
The bullwhip effect is depicted in the graph below. Observe the order quantities increasing exponentially upstream.

Finally, let’s look at some of the ways which companies adopt or can adopt to control this unwanted phenomenon.
- Bullwhip effect is inversely proportional to the forecast accuracy and hence improving the forecast accuracy reduces the bullwhip effect.
- Products with unstable demand are often planned with a fixed safety stock (in volume or number of units) rather than days (based on forecast). Products with highly sporadic demand (Class C) are often planned on a Make-to-Order basis.
- Batch sizes can be rationalised in accordance with the technical minimum batch size. However, Economic Order Quantities (EOQ) are often required which can be higher than the MOQ (Minimum Order Quantity) and calculated based on the sweet spot between changeover and stock holding cost.
- Having a stable production plan is quite important to avoid the fluctuations in the raw material requirements. There are many ways companies try to achieve this. Production wheel, group planning and campaign planning are some of the ways of achieving a stable production plan.
- DDMRP in principle causes a smaller bullwhip effect because it plans based on an average demand instead of a forecast (Average Daily Usage) and orders are triggered when stock goes below a certain buffer level. It does not work on the basis of getting back to the inventory target like the traditional MRP and inventory is allowed to flex between buffers. This is perhaps a topic for another time!
I hope you were able to understand the reasons behind the bullwhip effect, see it in action and also understand the ways the bullwhip effect can be limited.
Please share this article if you enjoyed reading it!
